USS / Nippon Steel
Merger Analysis Dashboard
By: Team 12 (Rambas)
Scenario
Steel Price Assumptions
HRC Price Factor
1.0x
Volume Factor
1.0x
Annual Price Growth
1.0%
Section 232 Tariff
EUR/USD Rate
1.08
Valuation Parameters
USS WACC
10.9%
USS WACC
10.9%
Nippon WACC (IRP-Adjusted)
7.95%
Terminal Growth
1.0%
Exit Multiple
5.0x
Synergy Execution
Synergies
Capital Projects
Advanced Inputs
Sources & Methods
Data provenance, model architecture, and key methodology for the USS/Nippon Steel merger valuation.
Model Architecture
5-stage valuation pipeline: Inputs → Price×Volume → EBITDA & FCF → DCF Valuation → Outputs
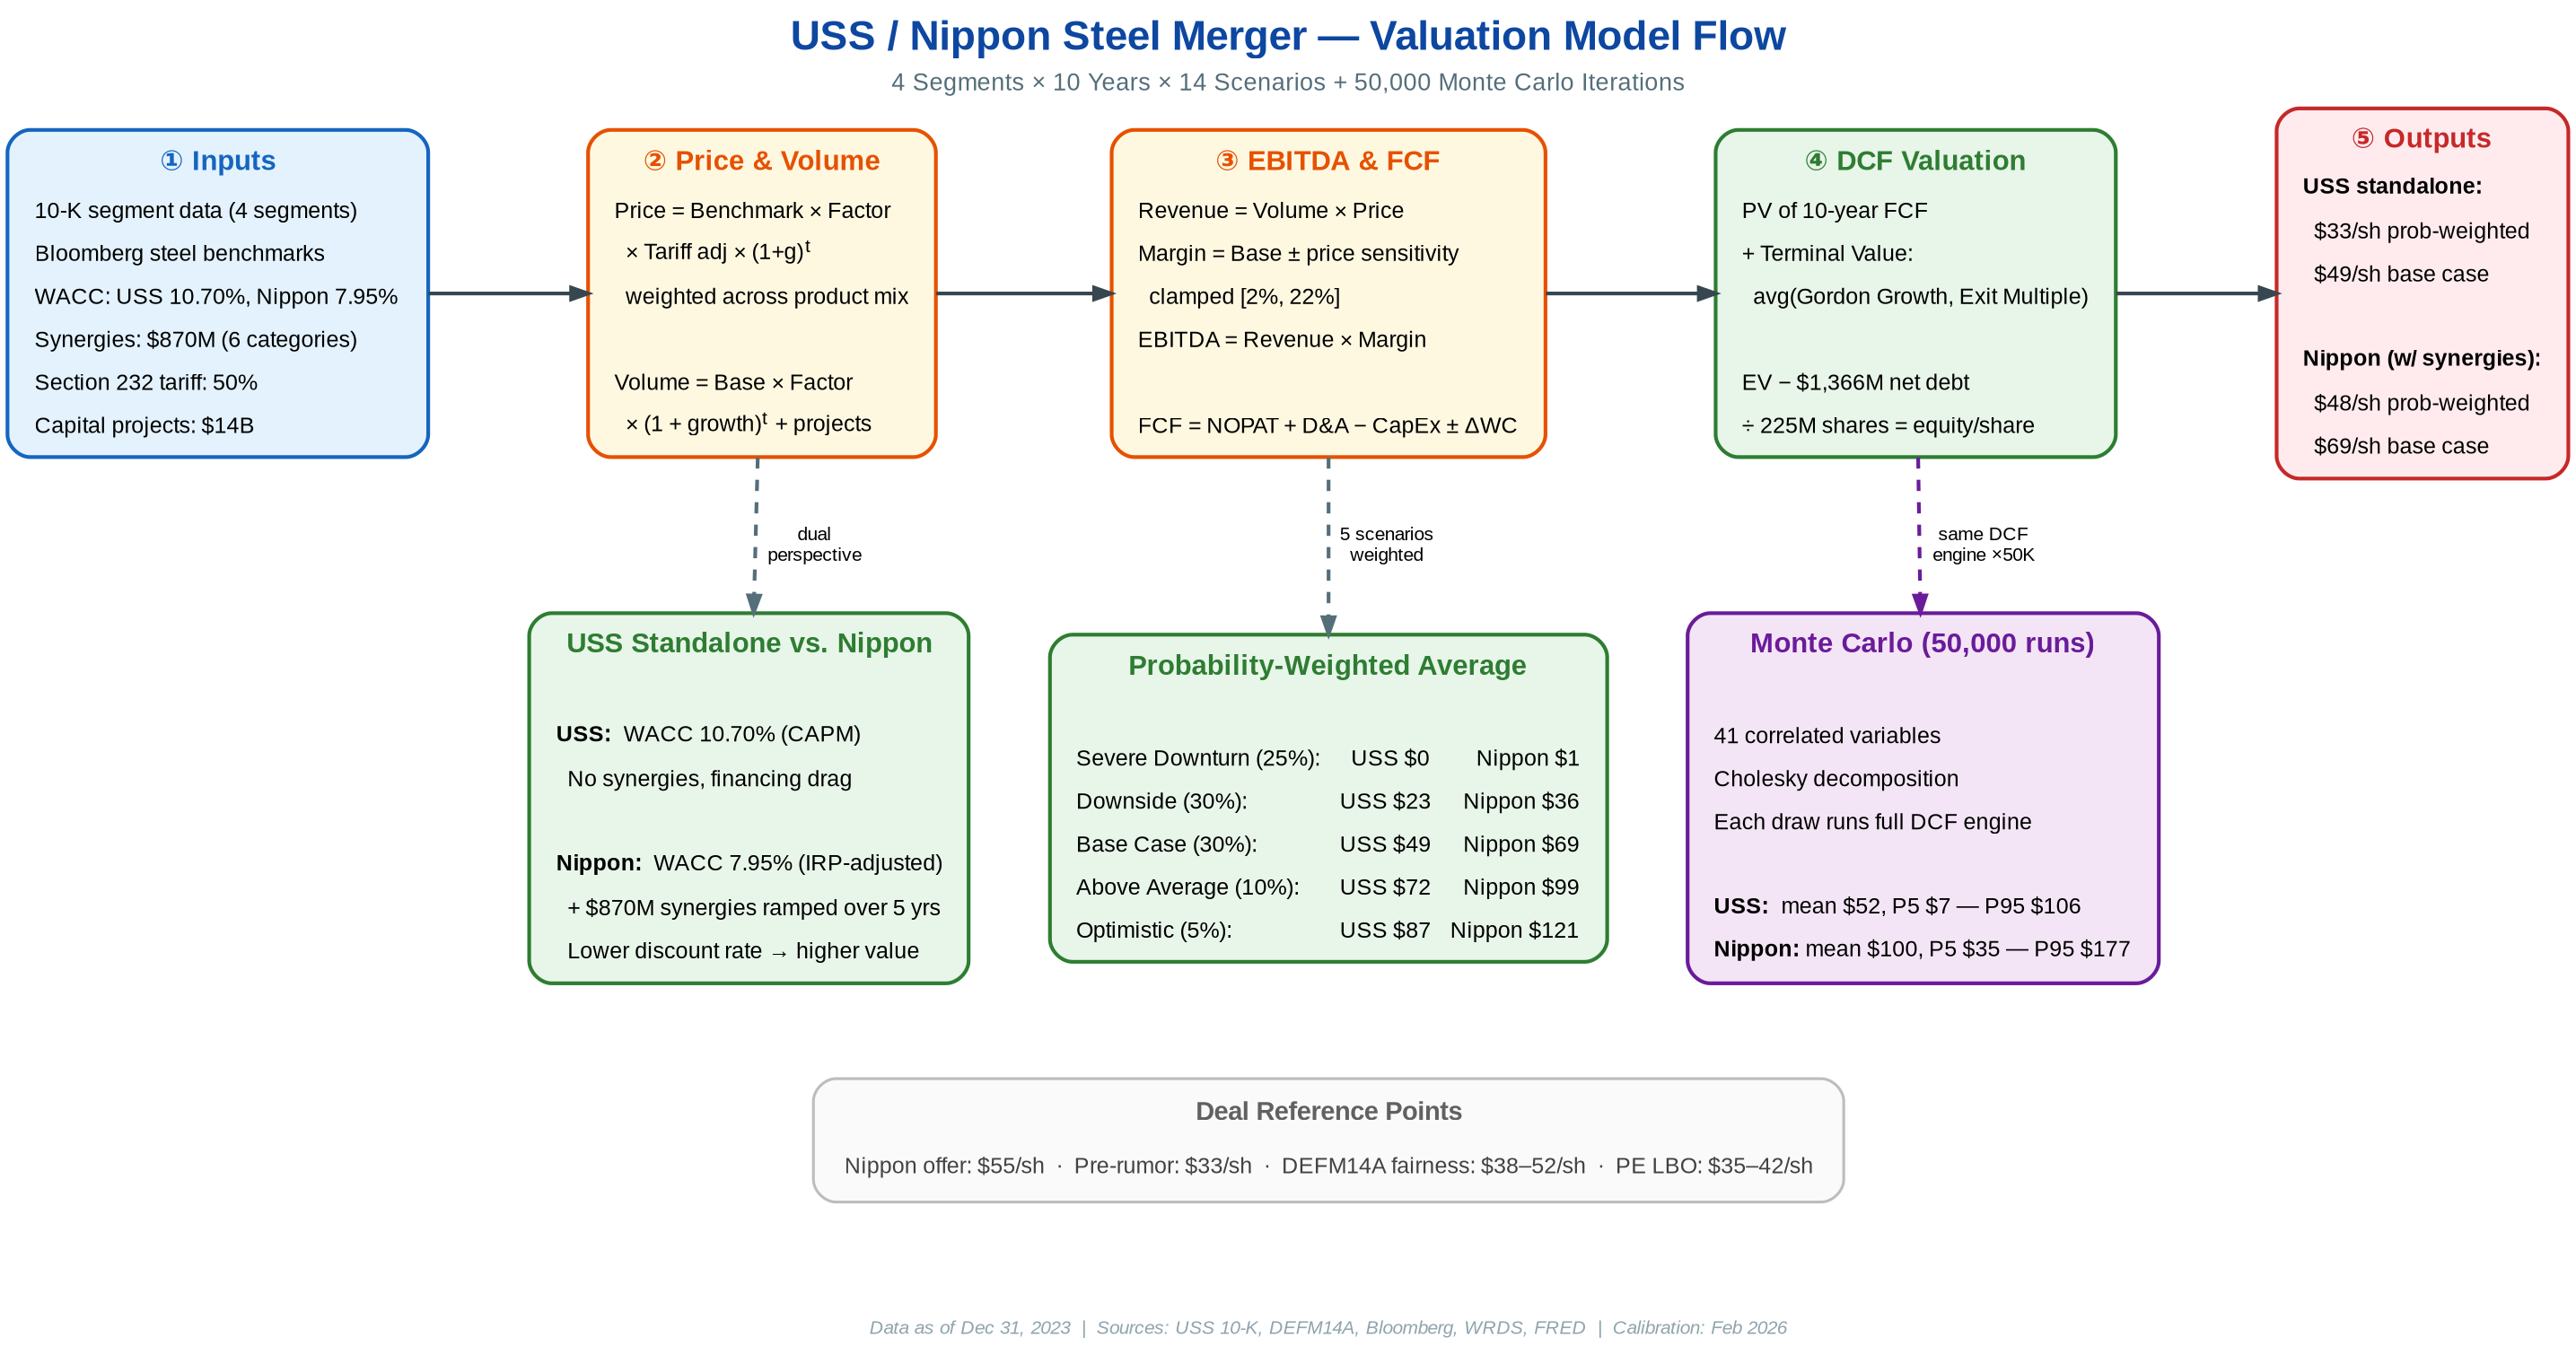
Figure: End-to-end model pipeline from data ingestion to valuation output.
Pipeline Stages
- Stage 1 — Inputs: Market data (FRED, WRDS), SEC filings (10-K, DEFM14A), and scenario parameters feed the model.
- Stage 2 — Price×Volume: Bottom-up revenue by segment. Through-cycle benchmark prices scaled by scenario factors and tariff adjustments.
- Stage 3 — EBITDA & FCF: Segment margins applied to revenue. CapEx (sustaining + growth), working capital, and taxes produce free cash flow.
- Stage 4 — DCF Valuation: 14 scenarios with dual terminal value (Gordon Growth + Exit Multiple). WACC cross-border adjusted via Interest Rate Parity.
- Stage 5 — Outputs: Per-share equity values for USS standalone and Nippon acquisition, probability-weighted across scenarios.
Data Sources
All primary data sources used in the valuation model. Sources are publicly available or from standard financial databases.
Key Methodological Choices
Non-obvious modeling decisions and their rationale.
Revenue: Bottom-up Price × Volume by segment (Flat-Rolled, Mini Mill, USSE, Tubular), not top-down regression.
Pricing: Through-cycle benchmarks (HRC $738, CRC $994, Coated $1,113) with tariff adjustment at current 50% Section 232 rate.
WACC: IRP-adjusted cross-border conversion (JPY→USD) for apples-to-apples Nippon comparison. USS 10.70%, Nippon 7.95%.
IRP Adjustment: Interest Rate Parity converts Nippon’s JPY-denominated WACC to a USD-equivalent rate: WACC_USD = (1 + WACC_JPY) * (1 + r_USD) / (1 + r_JPY) - 1. Japan’s near-zero risk-free rate (~0.9% 10Y JGB) vs the US rate (~4.3% 10Y UST) means a JPY WACC of ~4.1% translates to ~7.95% in USD terms. Without IRP, comparing a 4% JPY discount rate to a 10.7% USD rate would overstate Nippon’s valuation advantage by conflating currency differences with genuine cost-of-capital differences.
Terminal Value: Dual approach: Gordon Growth Model + Exit Multiple, blended 50/50 to reduce endpoint sensitivity.
Monte Carlo: 41 correlated variables, Cholesky decomposition for correlation structure, 50,000 simulations per run.
Synergies: 6-category framework with confidence weighting. $870M gross → ~$635M probability-adjusted net.
Margin Sensitivity: Validated against USS 10-K segment data (2019–2023). Empirical R² = 0.74–0.87 across segments.
Japan Tax Rate: 30.37% effective marginal rate combining national corporate tax (~23.2%), local inhabitant tax (~2.4%), enterprise tax (~3.6%), and special local corporate tax (~0.7%). Source: Japan Ministry of Finance. Applied to Nippon's after-tax cost of debt in the JPY WACC calculation.
Model source code available upon request.
Built with Reflex